In the past two months, two of the three largest IPOs YTD have priced. In September, Corebridge Financial went public with a $1.68B IPO and in October, Mobileye launched with a $990M IPO.
Several factors differentiate these two IPOs, including size, sector, and notably, aftermarket performance. On day one, Corebridge opened down 2.4% and finished down 1.3%, while Mobileye opened up 27.2% and closed up 38.0%.
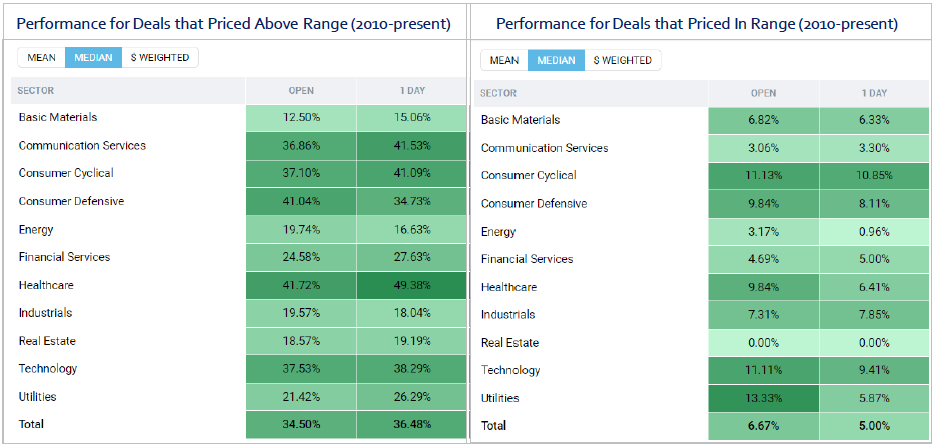
The key to understanding such contrasting aftermarket performance between the two issuers might lie in where they priced in relation to their initial range. Corebridge priced at the low end of its range whereas Mobileye priced above its range. Since 2010, CMG’s data shows that the median performance of an IPO that prices above its range opens up 34.5% while an IPO that prices in-range opens up only 6.7%.
The below tables further highlight how meaningful it is when an IPO prices above its initial range:

Contact [email protected] to request a demo.
This information provided is for informational purposes only, and should not be construed as legal, tax, investment, financial, or other advice. You should not act or refrain from acting on the basis of any of this information. Past performance is no guarantee of future results. CMG shall have no liability whatsoever for your use of this information.