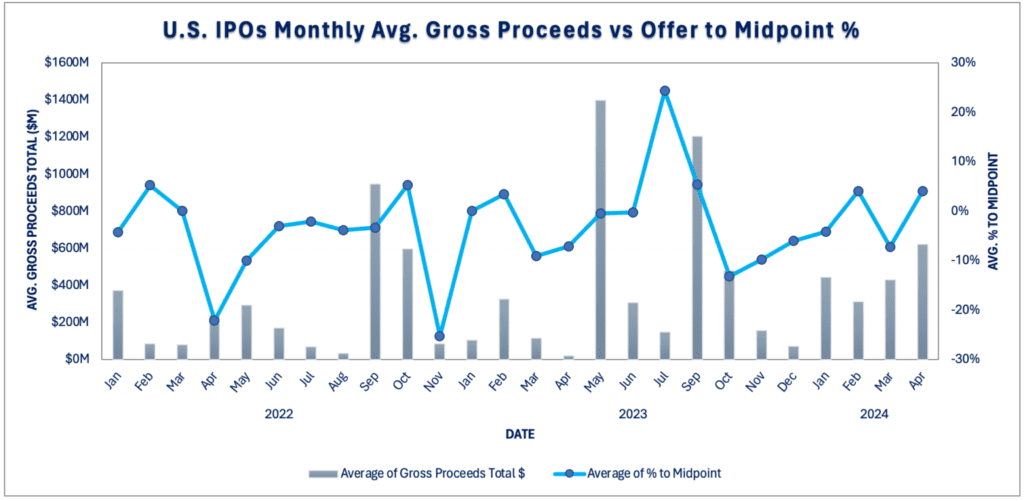
April kicks off Q2’24 with a flurry of IPO activity as YTD count and dollar volumes surge nearly 30% and 400%, respectively.
Despite the earnings season slump, U.S. ECM activity in April amounted to $11B via 35 offerings. U.S. IPOs contributed most of the dollar volume, with $5.6B raised via 9 offerings—a jaw-dropping 15,083% increase compared to IPO dollar volume in April 2023. Notably, all IPOs last month priced within or above the initial range, with 33% pricing above.
The average IPO size for the month was the highest since September 2023, at $619M compared to $1.2B — a trend noted in our Q1’24 U.S. ECM Recap. For the second time this year, two IPOs, UL Solutions Inc. and Vikings Holdings Ltd, raised over $1B in a single month. 2024 YTD four IPOs have raised over $1B compared to only three in all of 2023.
On average, this month’s IPOs traded up 19% on the open. UL Solutions Inc. and Viking Holdings Ltd traded up 22% and 9% on the open, respectively, while Loar Holdings outperformed the field, up 61% on the open.

Contact [email protected] to request a demo.
This information provided is for informational purposes only, and should not be construed as legal, tax, investment, financial, or other advice. You should not act or refrain from acting on the basis of any of this information. Past performance is no guarantee of future results. CMG shall have no liability whatsoever for your use of this information.