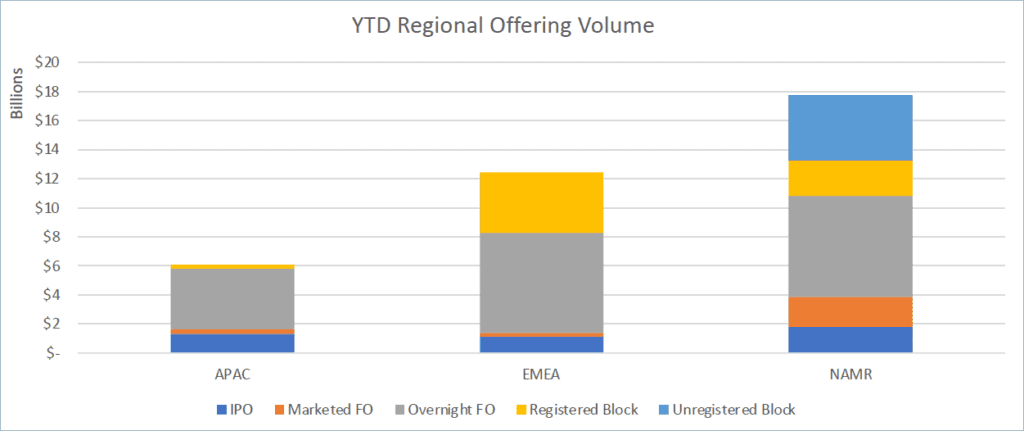
From January 1 to February 28, 2023, the global ECM market has produced 58 IPOs and 186 FOs accounting for $37.2B in offerings. The US has accounted for 49.5%, EMEA 33.33%, APAC 16.1%, with LATAM yet to do an offering. With investors continuing to look for new markets to invest their capital, it is important to look at the performance of the US compared to the rest of the globe during this time period.
CMG’s Aftermarket Performance Data shows a 3.03% Open Performance (OP) and 0.70% Current Performance (CP) for US offerings. In comparison, EMEA performed at 4.74% and 6.28% and APAC led the way at 16.12% and 14.22%, respectively.
Focusing more closely on the APAC region, India and Hong Kong have driven much of the volume and returns, accounting for over 50% of regional deal volume with 8.59% OP and 3.47% CP.
CMG’s historical data notes that during the same time period last year, the APAC region displayed definitive outperformance with 34.56% OP and 12.54% CP. This compares to the US with 10.48% OP and -31.27% CP, followed by EMEA with -0.21% OP and -40.65% CP.
Below we show the volume breakdown YTD by region in USD.

Contact [email protected] to request a demo.
This information provided is for informational purposes only, and should not be construed as legal, tax, investment, financial, or other advice. You should not act or refrain from acting on the basis of any of this information. Past performance is no guarantee of future results. CMG shall have no liability whatsoever for your use of this information.