CMG Launches DataLab™ MCP Server to Bring ECM Data Into AI Workflows | Read the Announcement

US Healthcare PIPEs Market Overview

A look at US healthcare PIPE issuance trends, sub-sector mix and pricing through October 2026.

Market Overview

Healthcare is the most prolific sector for PIPEs in the US, making up nearly a third of all PIPEs raised over the last decade.
 

US healthcare companies have raised $12.8B across 256 PIPEs in 2026 YTD, bringing the total since 2016 to $110.2B across 2,857 deals. Biotechnology accounts for 82% of this year’s capital and the average deal size of $50M is the highest since 2021.

Capital raised and deal count

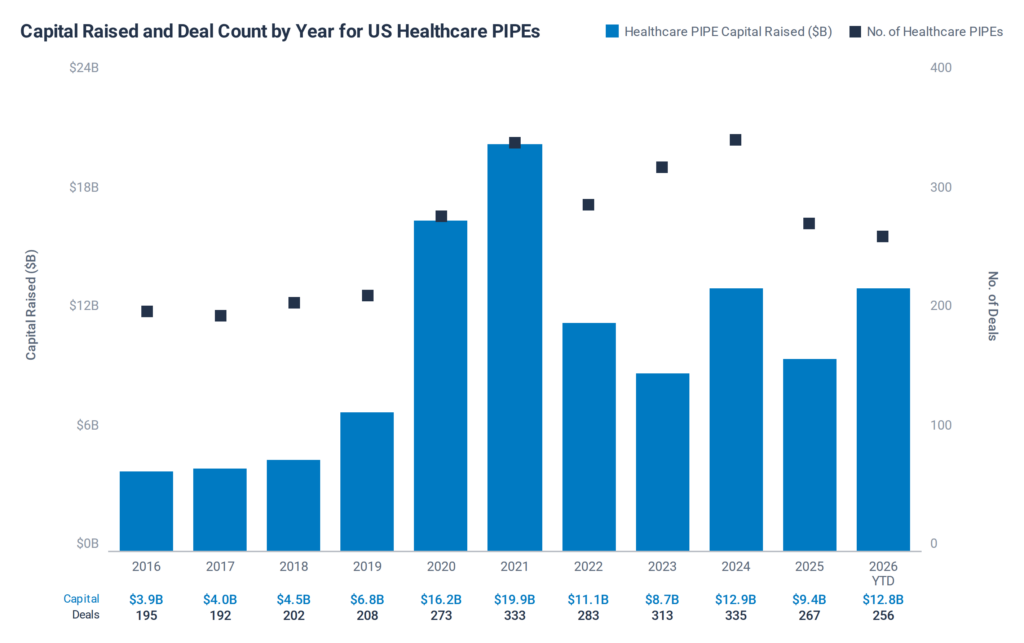
Healthcare PIPE capital raised in 2026 YTD is $12.8B across 256 deals, within $0.1B of 2024’s full-year total of $12.9B. Annual capital raised peaked in 2021 at $19.9B across 333 deals.
Average deal size

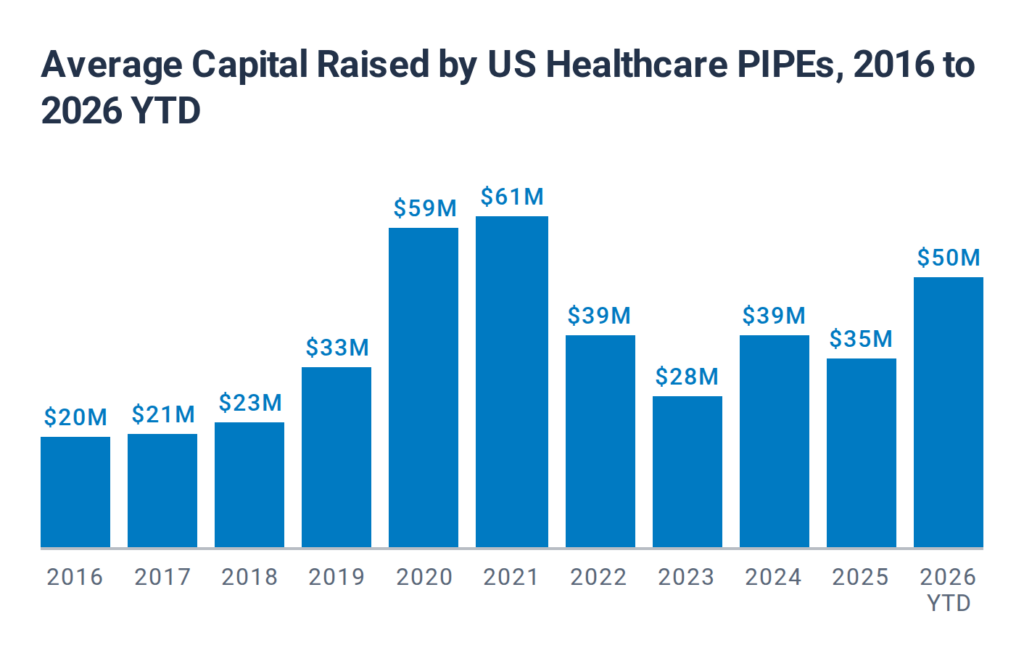
The average healthcare PIPE has raised $50M in 2026 YTD, up from $35M in 2025 and the highest since 2021’s $61M. In 2016 the average was $20M.
Healthcare PIPEs market overview

Sub-sector mix

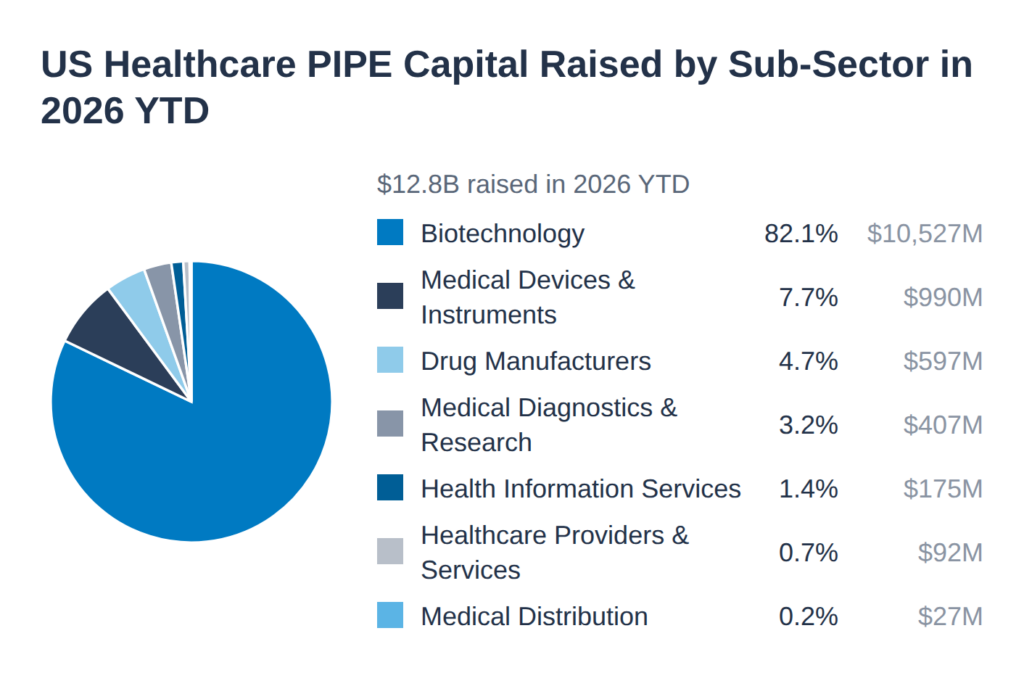
Biotechnology accounts for 82.1% of healthcare PIPE capital raised in 2026 YTD ($10.5B), up from 53% in 2016. Medical devices and instruments account for 7.7%, down from 15.1% in 2016, and medical diagnostics and research for 3.2%, down from 11.0%.
Healthcare PIPEs market overview


Discounts across offering types

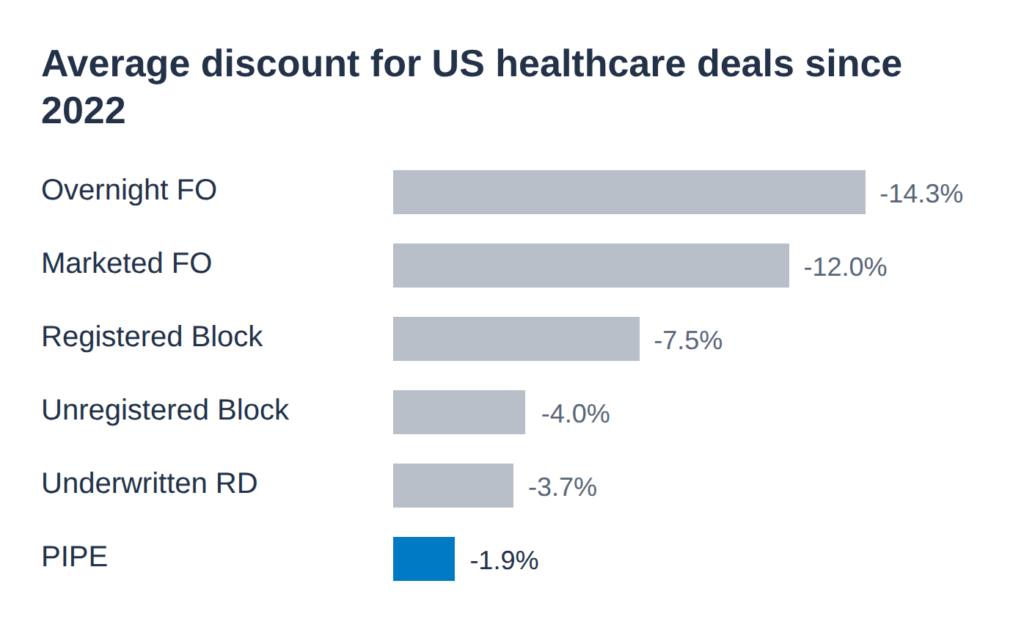
Since 2022, US healthcare PIPEs have priced at an average discount to last trade of 1.9%. That compares with 3.7% for underwritten registered directs, 4.0% for unregistered blocks, 7.5% for registered blocks, 12.0% for marketed follow-ons and 14.3% for overnight follow-ons.
Healthcare PIPEs market overview

Post-IPO financing

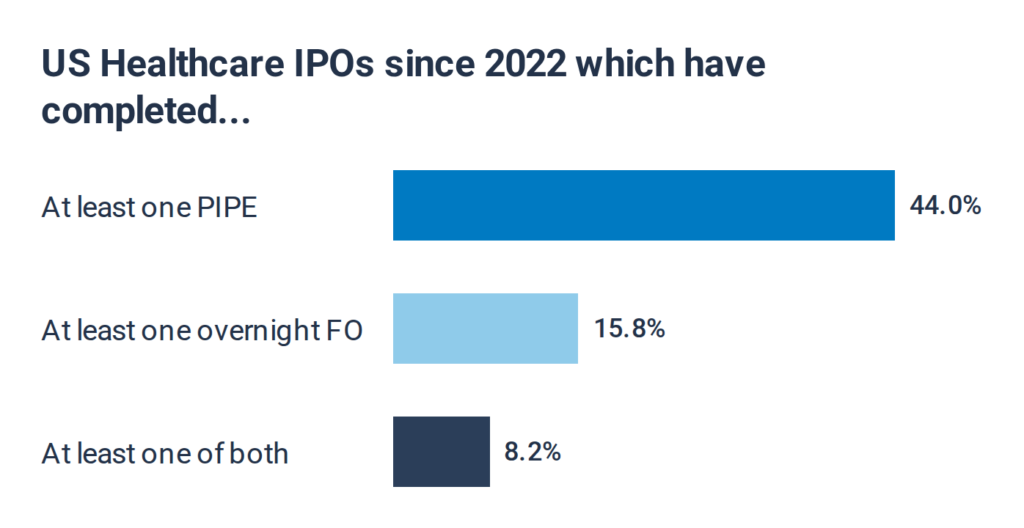
Of the 184 US healthcare IPOs since 2022, 44.0% have since completed at least one PIPE, 15.8% at least one overnight follow-on and 8.2% both.
 

Healthcare PIPEs 2026 market overview

Explore the data

PIPEs and registered directs data is available in CMG DataLab, with time-stamped terms, investor information, allocations, pricing and warrant structure across 10+ years of history. To explore the underlying data, contact us.


Related reading


By Rhiannon Chelley

Contact [email protected] to request a demo.

This information provided is for informational purposes only, and should not be construed as legal, tax, investment, financial, or other advice. You should not act or refrain from acting on the basis of any of this information. Past performance is no guarantee of future results. CMG shall have no liability whatsoever for your use of this information.

Sign Up for Updates

Get the latest news and insights from CMG.

Leverage the CMG Network

Leading financial institutions rely on CMG to manage their ECM business. Get in touch to learn how CMG can help your business, too.